MS Sentinel Intelligence Dashboard
As a contractor for FirstPort Property, I deployed a Microsoft Sentinel threat intelligence dashboard that reduced alert volume by 65% through structured KQL detection tuning — transforming the organisation's SOC from a reactive, alert-driven operation to a proactive, intelligence-led one.
Client confidentiality
Some operational and technical details in this case study have been generalised to protect client confidentiality. The scope, outcomes and my role are accurately represented.
The Challenge
As Lead Security Engineer engaged by a major financial services enterprise, I was brought in to address a severe alert fatigue problem that was undermining the effectiveness of the Security Operations Centre. The volume of low-fidelity alerts generated across the organisation's Microsoft security stack meant that actionable intelligence was buried in noise — critical threats were being identified and remediated too slowly, increasing dwell time and exposing the organisation to growing business risk.
- High alert volume with a poor signal-to-noise ratio — analysts were manually triaging thousands of low-fidelity notifications with no structured prioritisation or suppression in place
- No centralised visibility across the threat landscape — intelligence was fragmented across multiple tools with no single operational picture available to the SOC
- Executive reporting was manual and inconsistent, with no real-time board-level view of the organisation's security posture or trending threat activity
The Approach
I designed and built an interactive Microsoft Sentinel dashboard tailored for dual purpose: real-time SOC monitoring and automated executive-level security reporting.
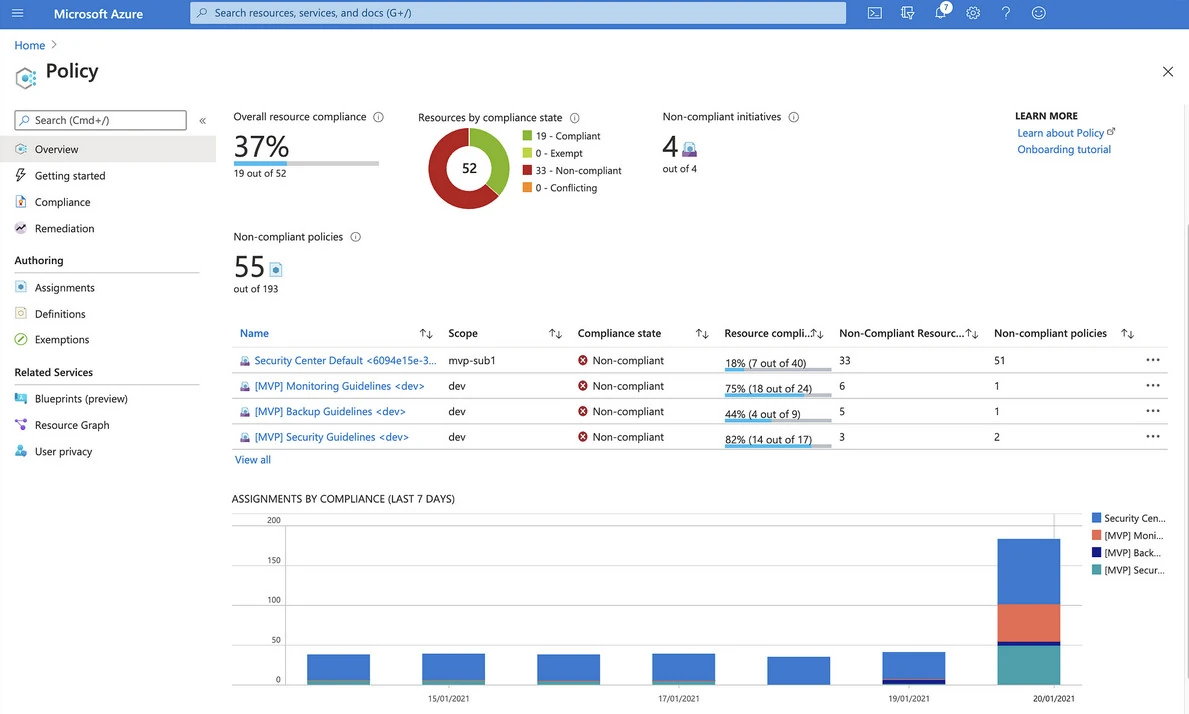
I authored custom KQL (Kusto Query Language) detection rules to correlate low-fidelity signals into high-confidence incidents, with all detection logic mapped directly to the MITRE ATT&CK framework to support a threat-informed defence posture. I then designed and implemented automated alert suppression rules targeting known false-positive patterns — reducing the volume of noise reaching analyst queues by 65% from baseline. I structured the dashboard into two distinct views: an analyst operational view surfacing prioritised, high-confidence incidents, and an executive summary view delivering automated board-level reporting without manual data collation.
The Results
I delivered a production-ready, MITRE ATT&CK-aligned threat intelligence dashboard that gave the SOC an immediate, unified operational picture and freed analysts from the noise of low-fidelity alerts — shifting the team's posture from reactive triage to proactive, intelligence-led hunting.
Business & Security Impact
- Alert volume reduced by 65% through structured KQL detection tuning and automated false-positive suppression, returning analyst focus to genuine, high-confidence threats
- Mean Time To Respond (MTTR) improved by centralising all critical threat telemetry onto a single Microsoft Sentinel pane of glass, eliminating tool-switching and manual correlation
- Executive security reporting fully automated — board-level dashboards now delivered without manual data collation, improving governance visibility and reporting consistency
- Detection logic aligned to MITRE ATT&CK, enabling threat-informed defence and supporting compliance with threat intelligence and detection engineering requirements
- Scalable, maintainable KQL ruleset established — the detection framework continues to operate and evolve with the threat landscape without ongoing consultancy dependency
My deep, hands-on experience with Microsoft Sentinel's KQL query language and detection engineering — built across multiple financial services deployments — allowed me to identify and suppress the specific false-positive patterns driving the alert fatigue from the first week of the engagement, rather than requiring extended baselining periods. The 65% reduction was achieved before the full dashboard was even deployed.